

Twitter Social Network Visualisation
with Gephi (extracted from MA Dissertation)
You can right-click “Open Image in New Tab” for larger images (可以右键“新窗口打开 ”放大图片)
Background
This is part of my Master’s Dissertation on the topic of network visualisation.
The data was first collected via a Python-based toolset deployed on a VPS server. The toolset utilises Twitter API to capture live data from Twitter according to certain filters I set up. The next step is to organise and analyse the data in R Studio, refining input and format before being visualised. Then the refined data are exported to Gephi for visualisation.
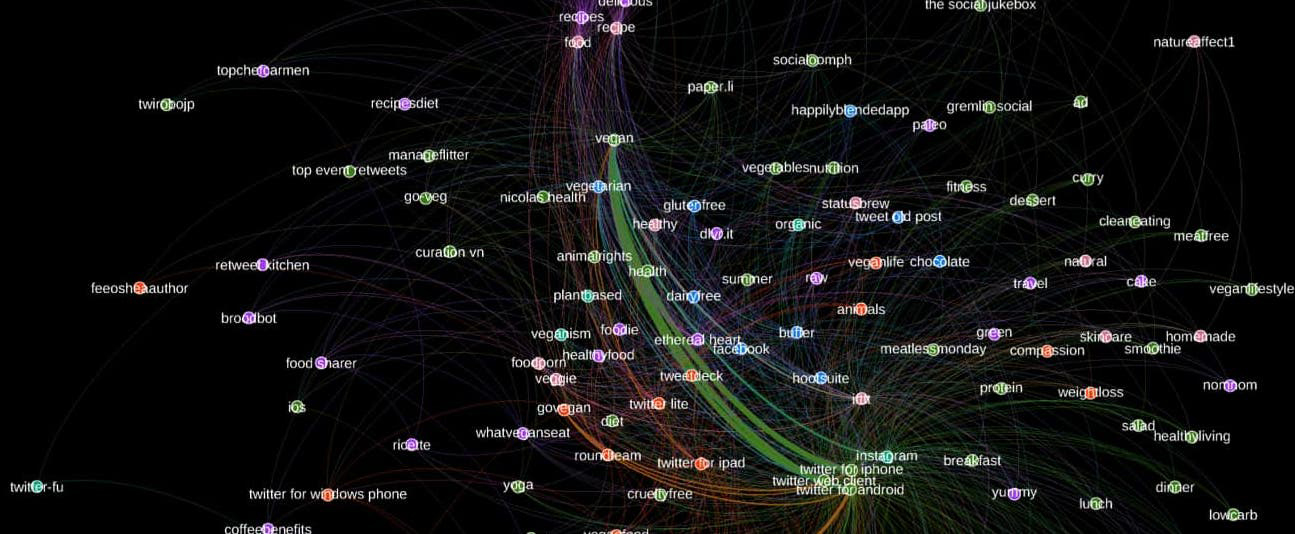
Client-hashtag Co-occurrence Graph
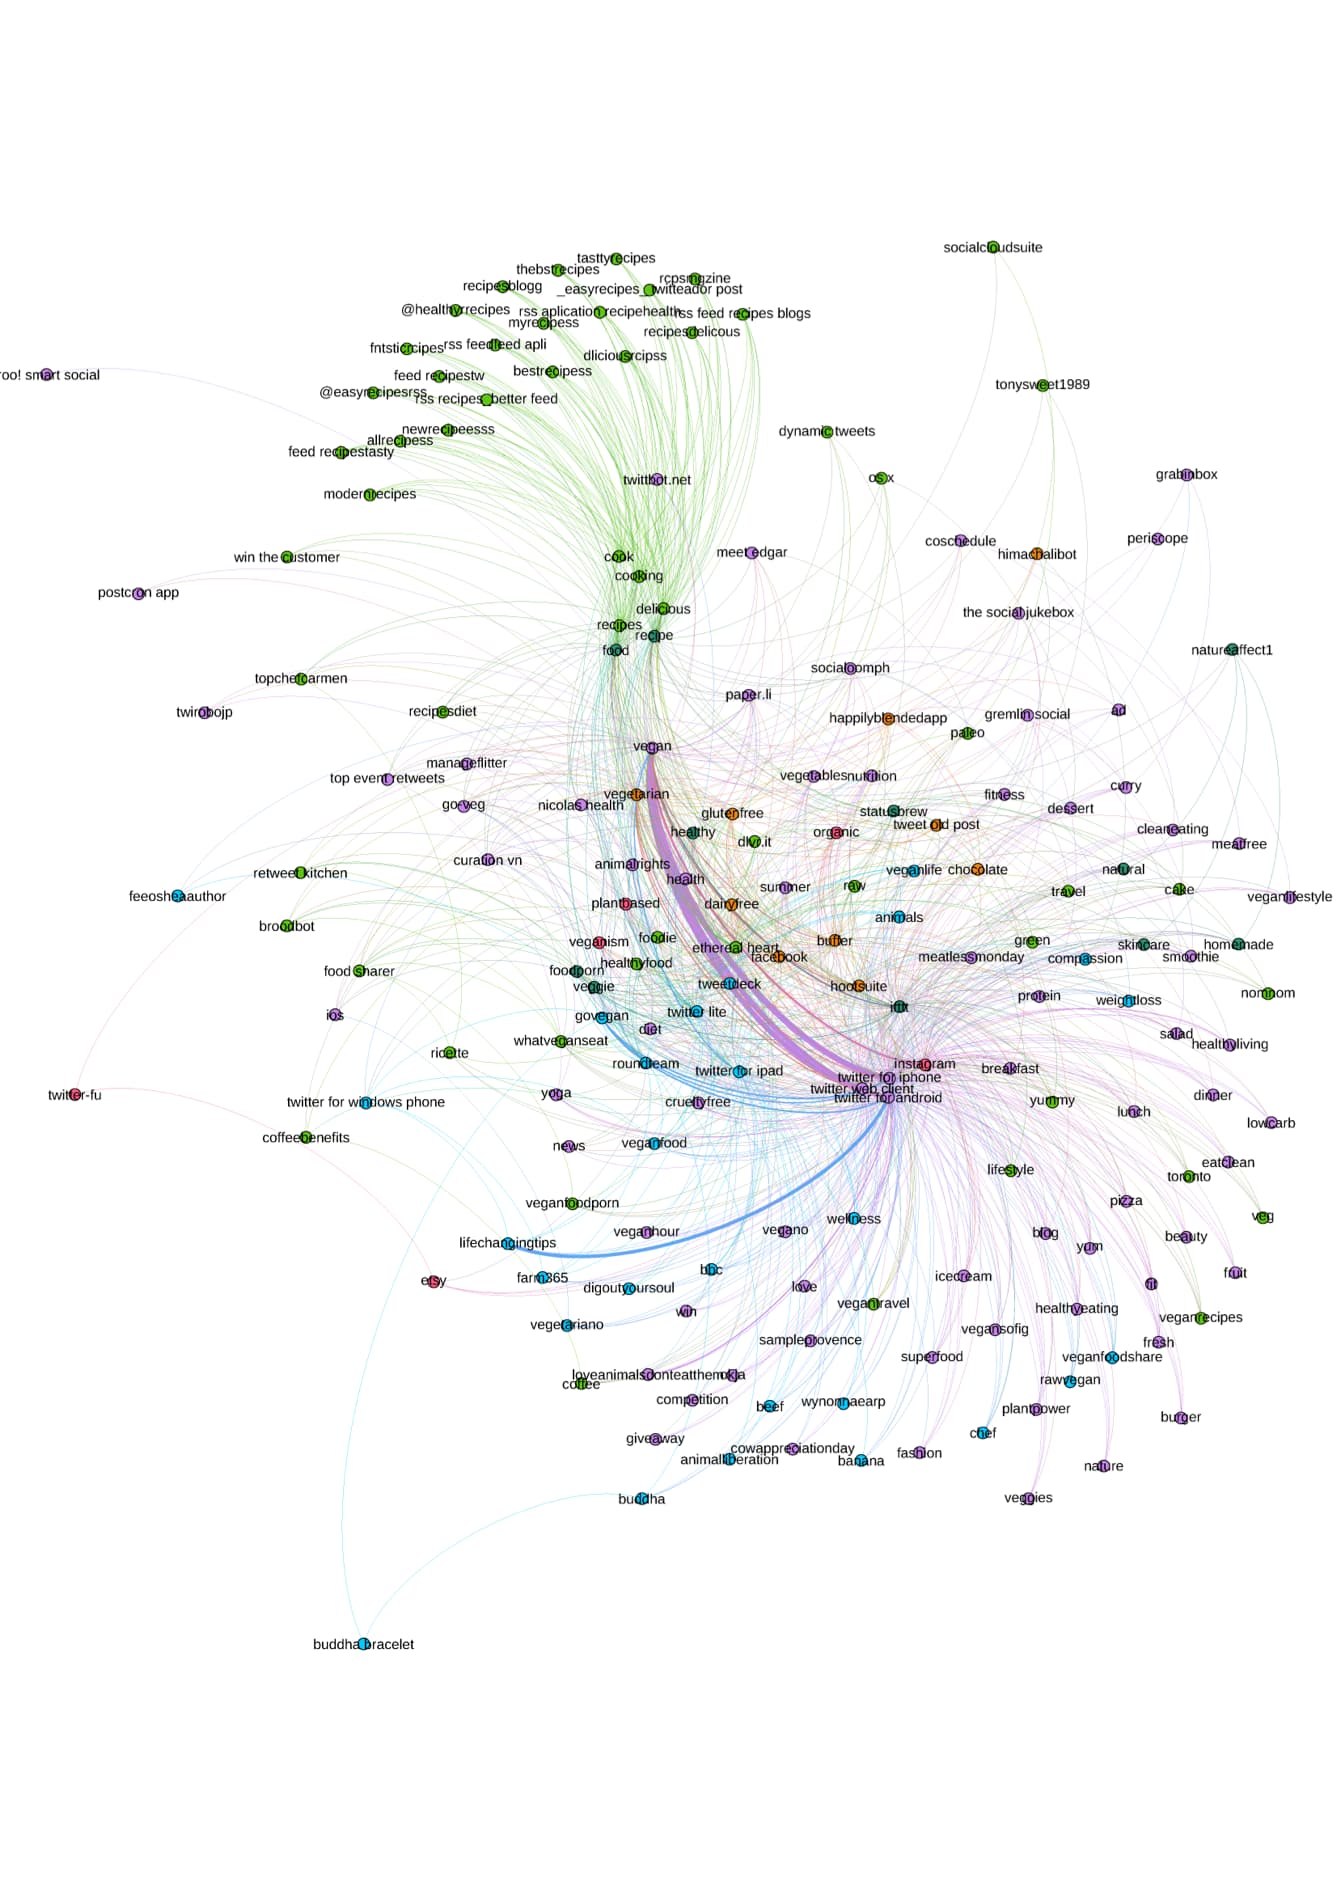
Bipartite Hashtag-user Graph
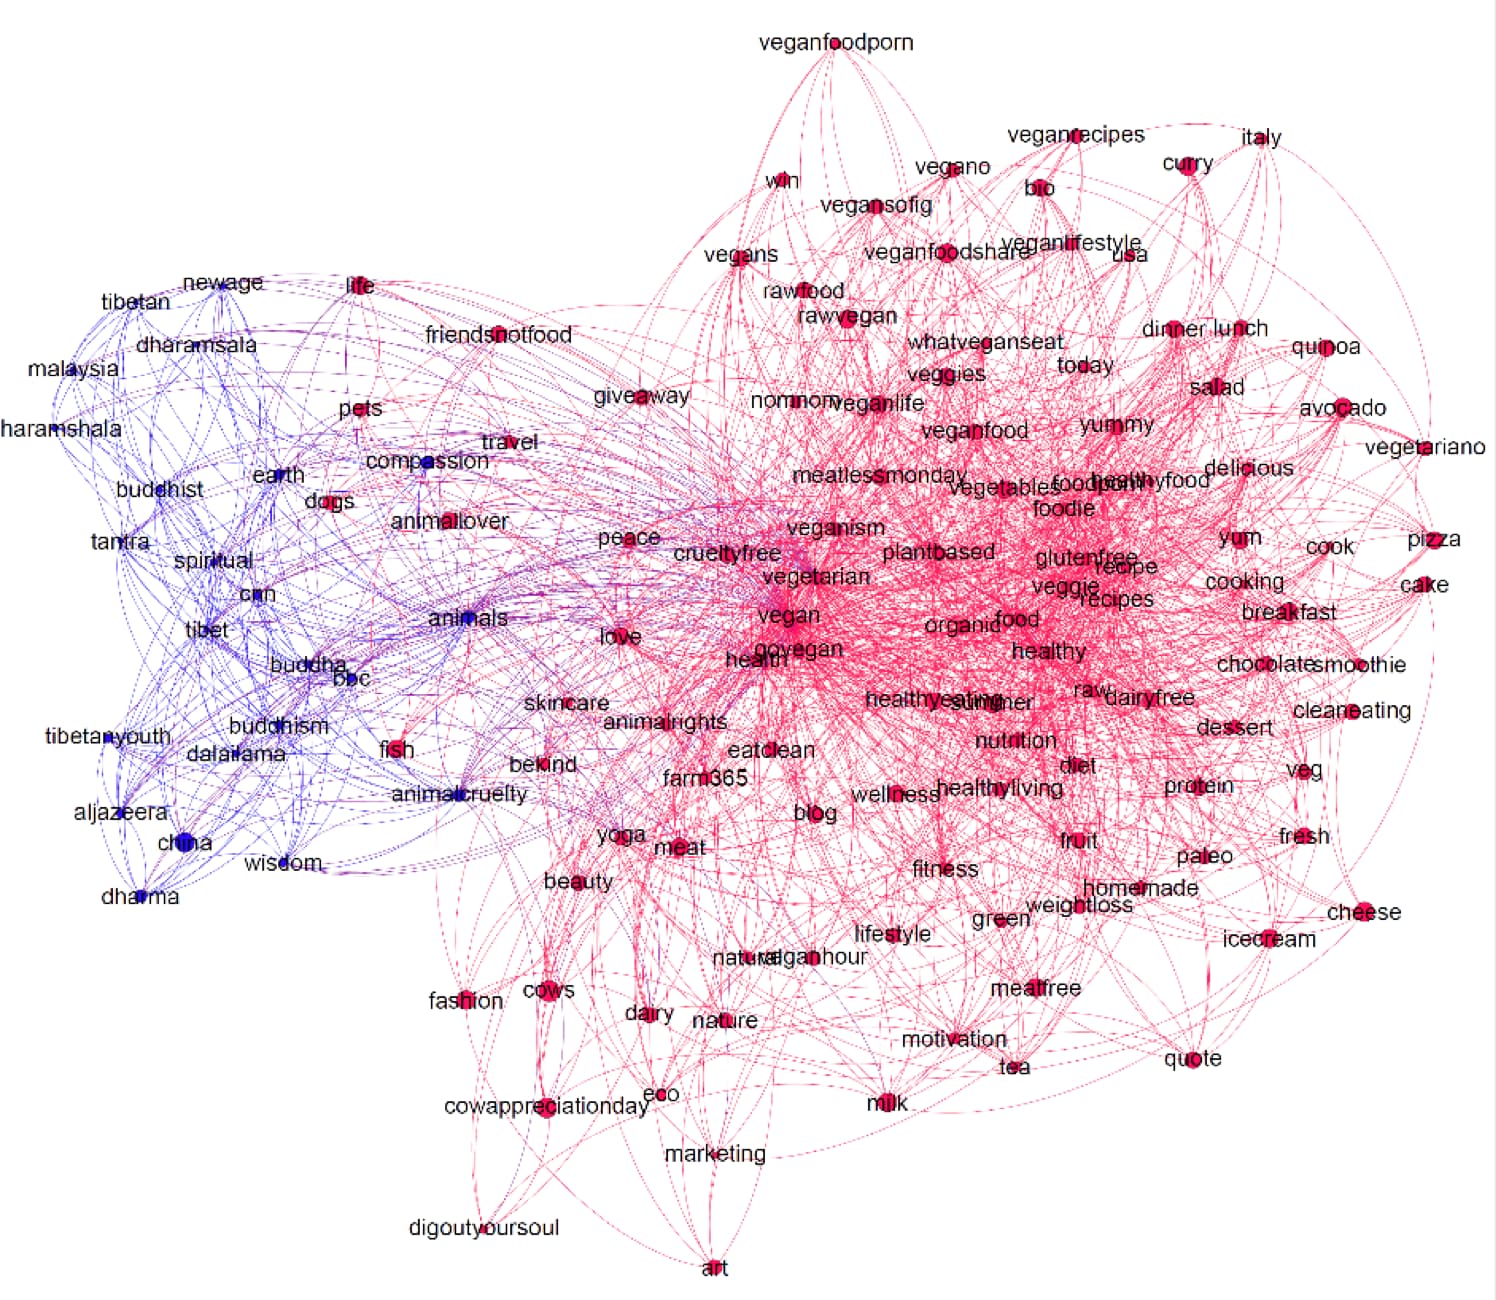
Revisited Co-hashtag Graph
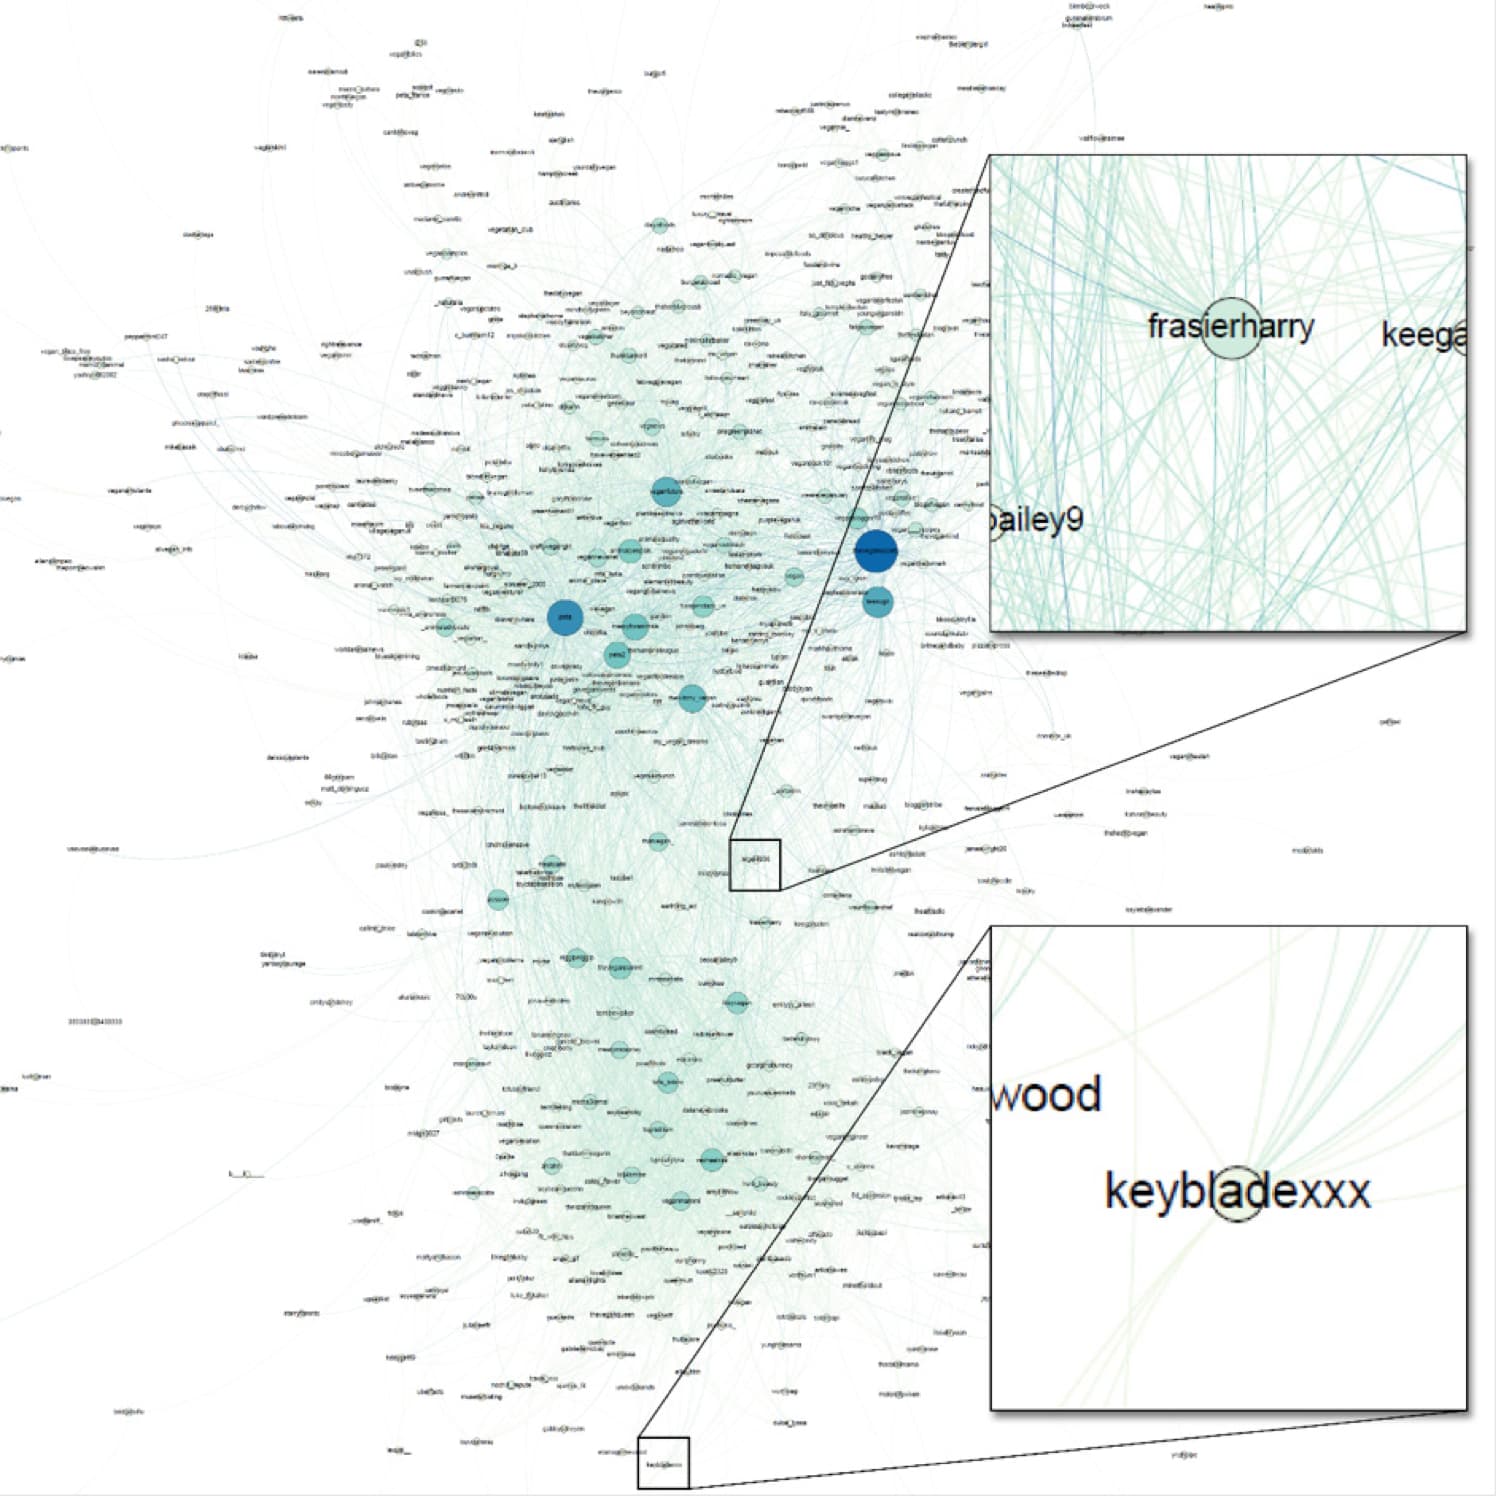
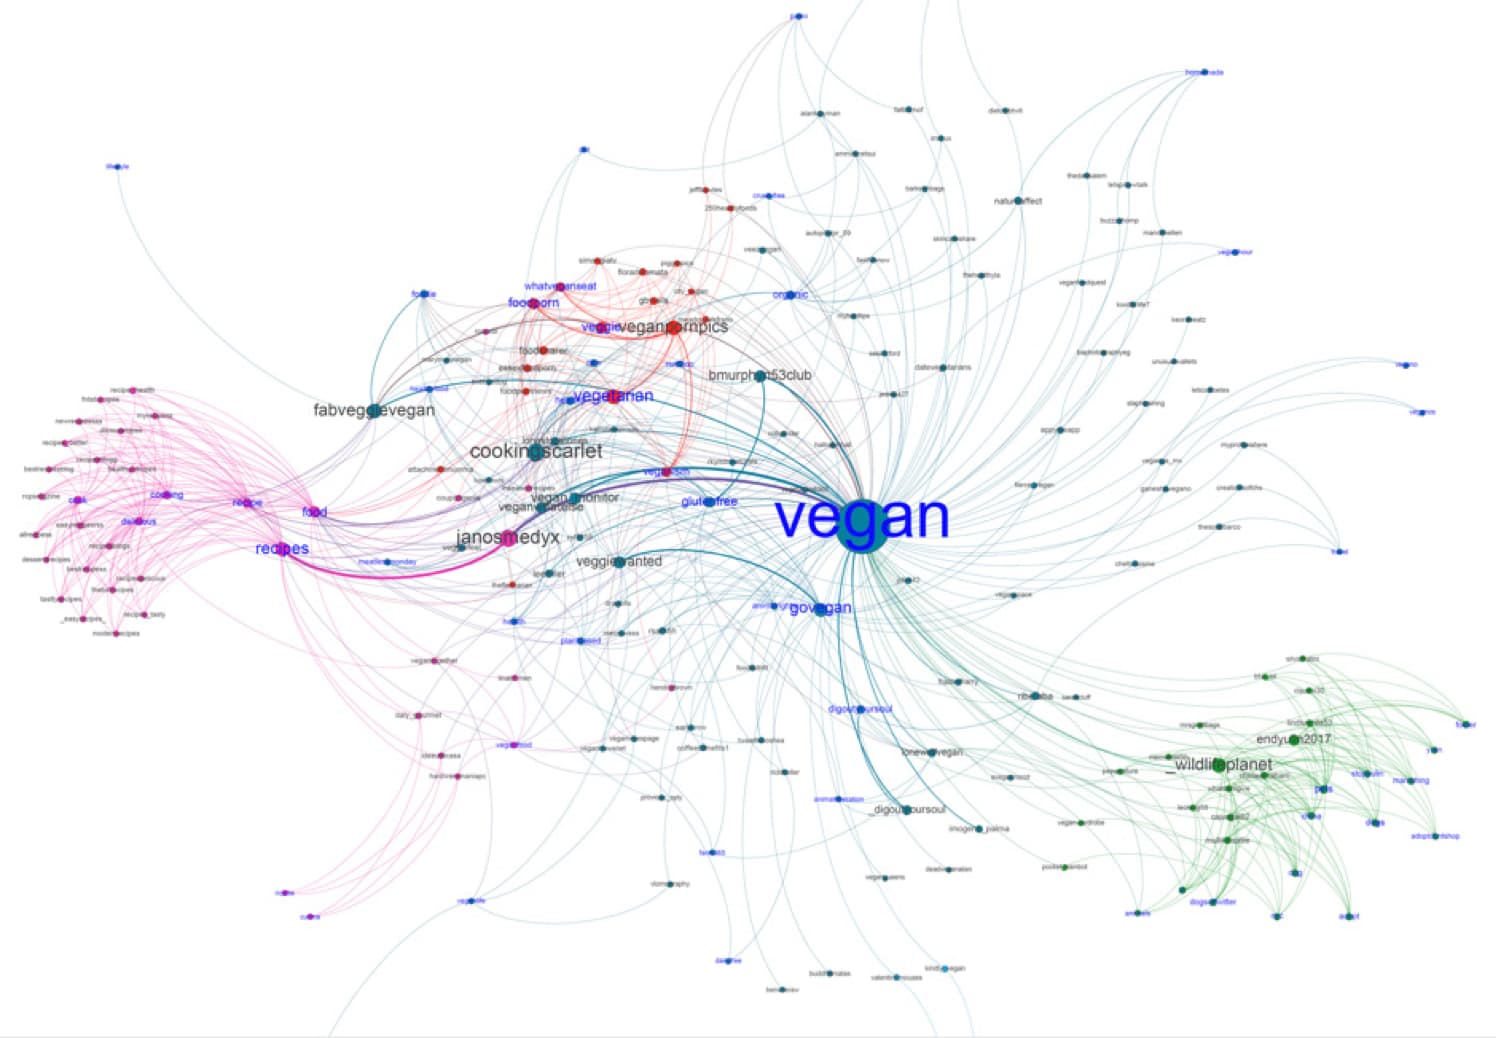
Social Graph by Mentions - Betweenness Centrality
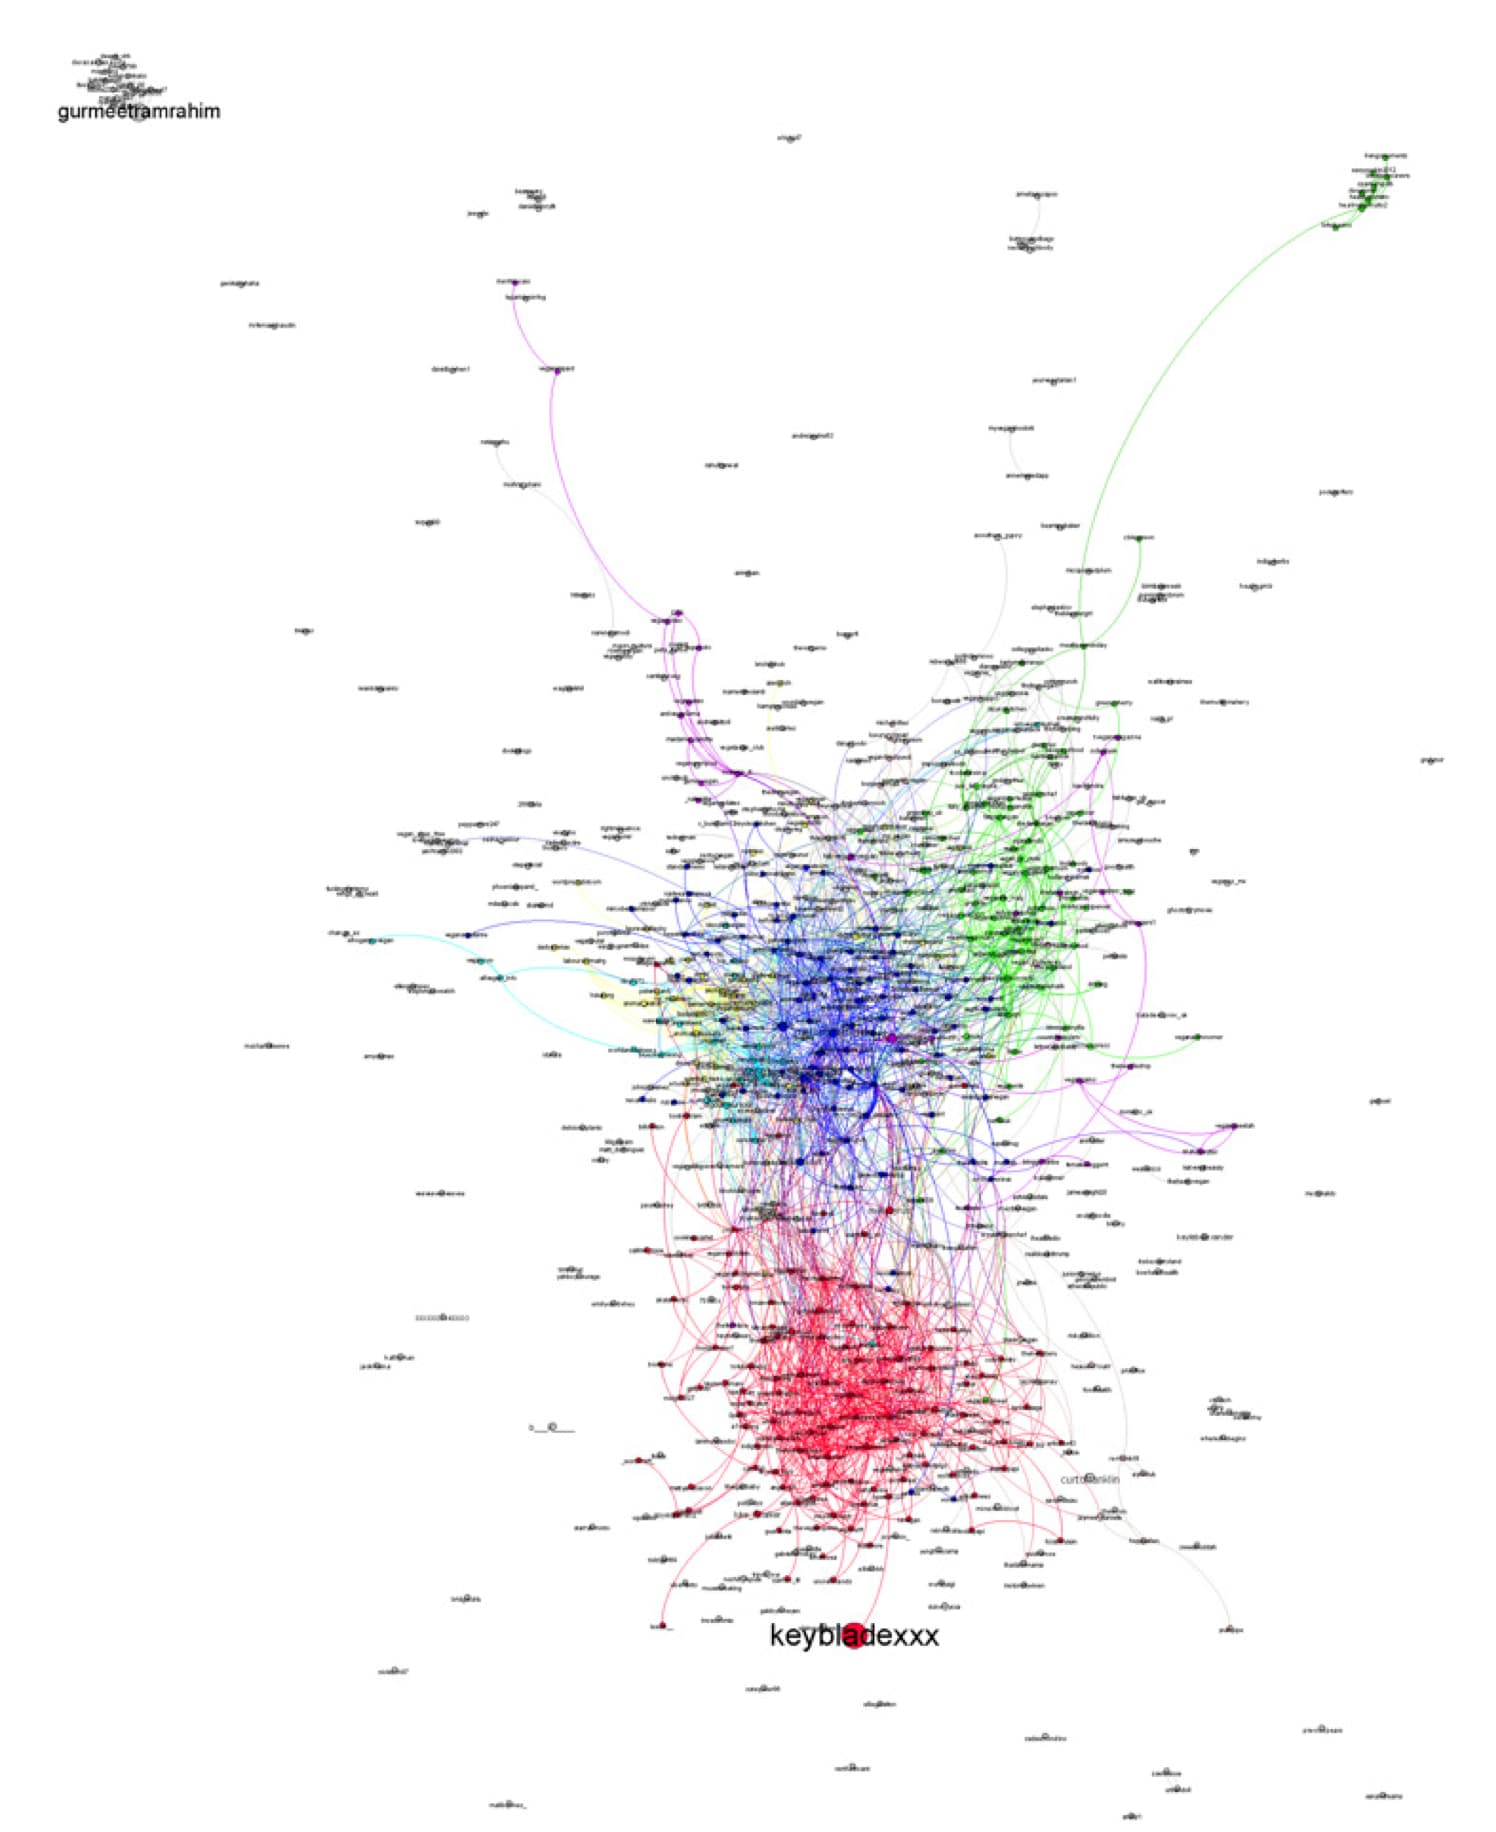
Social Graph by Mentions, Modularity R = 1